Backtesting Log & Strategy Tester Spreadsheet
Manual backtesting with R-multiples, setup comparison and a confidence range for your edge
Price: ₹449 (one-time purchase)
Format: ZIP (XLSX + PDF)
Delivery: Instant download after payment is confirmed.
Category: Trading Journals
Description
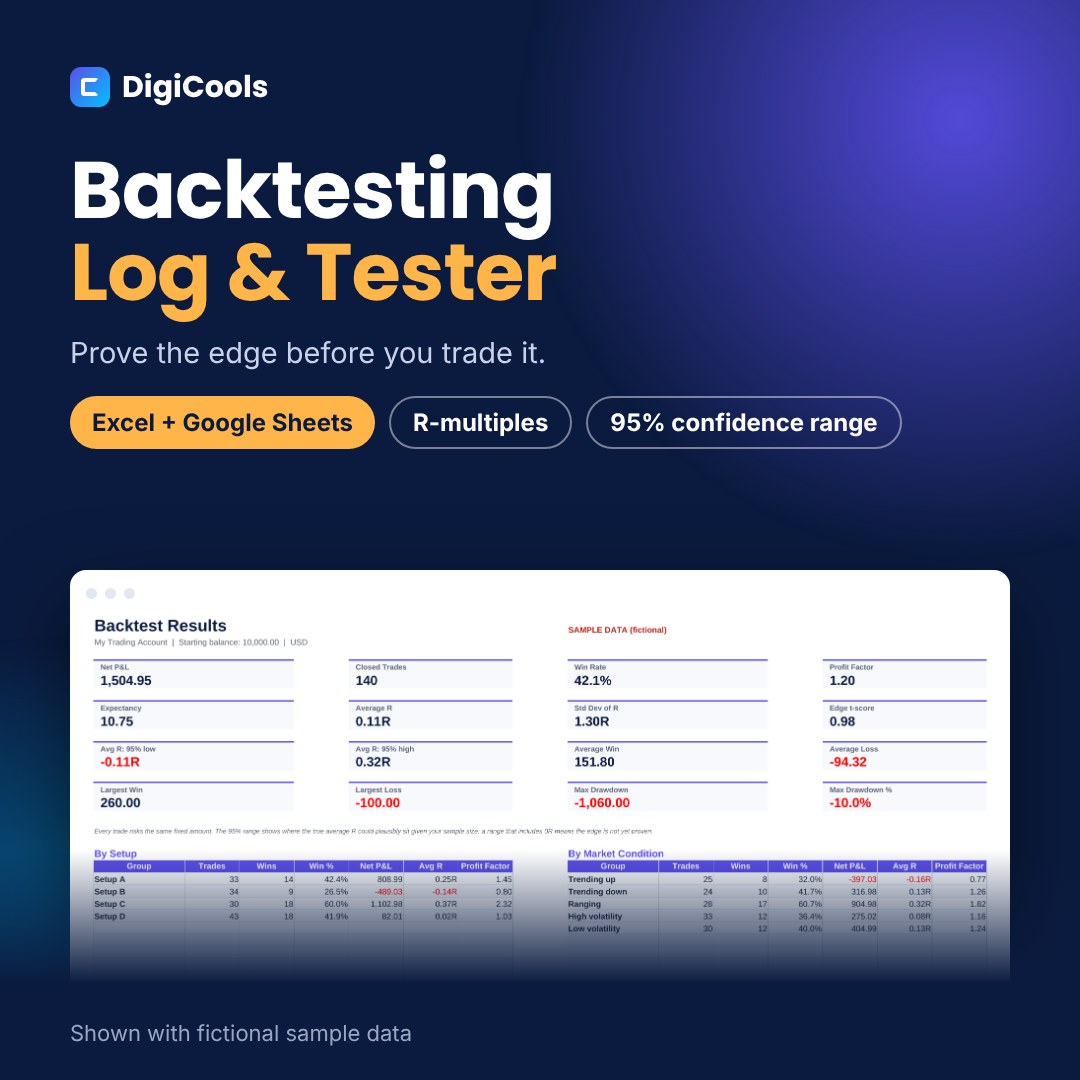
A backtest with 20 trades can look brilliant and mean nothing. This log measures every setup in R with a fixed simulated risk, and adds a 95% range and t-score for your average R, so you can tell an edge from luck before you trade it live. A manual backtesting spreadsheet for Excel and Google Sheets. Log historical trades in R, compare setups and market conditions, and see a 95% confidence range for your average R. WHO IT'S FOR Traders who backtest strategies by hand on charts before risking money, for any market and timeframe. WHAT'S INSIDE • Backtesting Log workbook, blank — Excel XLSX, 6 tabs (192 KB) • Sample workbook with 140 fictional rows — Excel XLSX (211 KB) • Quick Start Guide — PDF, A4, 6 pages (1.1 MB) • README with contents, license and support — TXT HOW IT HELPS • Backtest log with 500 rows: setup, timeframe, market condition, direction, entry, stop, target, exit and exit reason • R-multiple, planned reward:risk and simulated P&L with a fixed risk per trade • Dashboard with win rate, profit factor, expectancy, average R, standard deviation of R, t-score and a 95% range for average R • Breakdowns by setup, market condition, timeframe, exit reason, direction and weekday • Monthly results, equity curve and drawdown of the simulated account • Rules-met flag to separate clean trades from discretionary ones HOW TO USE 1. Download and unzip the file. 2. Open Backtesting-Log-Blank.xlsx in Excel, or upload it to Google Drive and choose File > Save as Google Sheets. 3. On Settings, name your setups and set the simulated risk per trade. 4. Log every backtest trade in the Trade Log, including losers. Type only in the soft-gold cells. 5. Review the Backtest Results dashboard, Monthly and Charts tabs. COMPATIBILITY Microsoft Excel 2019 or newer (including Microsoft 365), Google Sheets and LibreOffice Calc. No macros or add-ins. GOOD TO KNOW This is a manual tool: it does not connect to any broker or data feed. Educational record-keeping tool only, not financial advice; it does not predict or guarantee any result. Sample data is fictional. LICENSE Personal use. You may edit the files for your own records but not resell, share or redistribute them.
What's included
- Backtesting Log workbook, blank — Excel XLSX, 6 tabs (192 KB)
- Sample workbook with 140 fictional rows — Excel XLSX (211 KB)
- Quick Start Guide — PDF, A4, 6 pages (1.1 MB)
- README with contents, license and support — TXT
- Single ZIP download (1.0 MB)
Frequently asked questions
Do I need coding skills?
No. You review historical charts and log each trade your rules would have taken.
Why use a fixed risk per trade?
It puts every trade on the same scale, so setups and periods can be compared fairly in R and in money.
What does the 95% range mean?
It shows where the true average R could plausibly be, given your sample size. If it includes 0R, the edge is not proven yet.
Does it include fees or slippage?
Not separately. Adjust your exit prices to include expected costs if you want a more conservative test.
Does it work in Google Sheets?
Yes. Upload the .xlsx to Google Drive and save it as a Google Sheets file.
Can I share it?
No. The license is for personal use only.
Tags: backtesting spreadsheet, manual backtesting, strategy tester, backtest log, r multiple tracker, trading strategy, trading journal excel, trading journal google sheets, expectancy calculator, trading edge